
As a Senior consultant data scientist, I’m very aware of the importance of summarizing my work into Dashboards and Apps.
This allows me to popularise my algorithms and work and put them into instinctive graphics for better and faster understanding. In this article, we will go through one of the most famous tools and python libraries used in designing dashboards and applications.
The summary is as follows:
- Dash by Plotly
- Streamlit
- Bokeh
- Elastic stack
- Heroku deployment
Dash by Plotly
Dash is an open-source tool developed by Plotly. It allows to insert multiple types of widgets with the possibility of choosing the disposition and the style since dash’s layout is HTML-based and allows CSS styling.
The setup is done by running the following command line:
pip install dash
pip install dash_core_components
pip install dash_html_components
The layout of a dash application is a hierarchical tree of components, a mix between HTML elements and graphs built using:
- dash_html_components library provides classes for all of the HTML tags, and the keyword arguments describe the HTML attributes like style, className, and id. Using this library, we can add HTML elements such as
Div, H1, P,... etc. For more details, I advise you to check its documentation. - dash_core_components library generates higher-level components like controls and graphs and uses Plotly’s syntax. For instance, we can insert a
Button, Dropdown, Slider,DatePickerRange, ... etc.. For more details, please visit the official website.
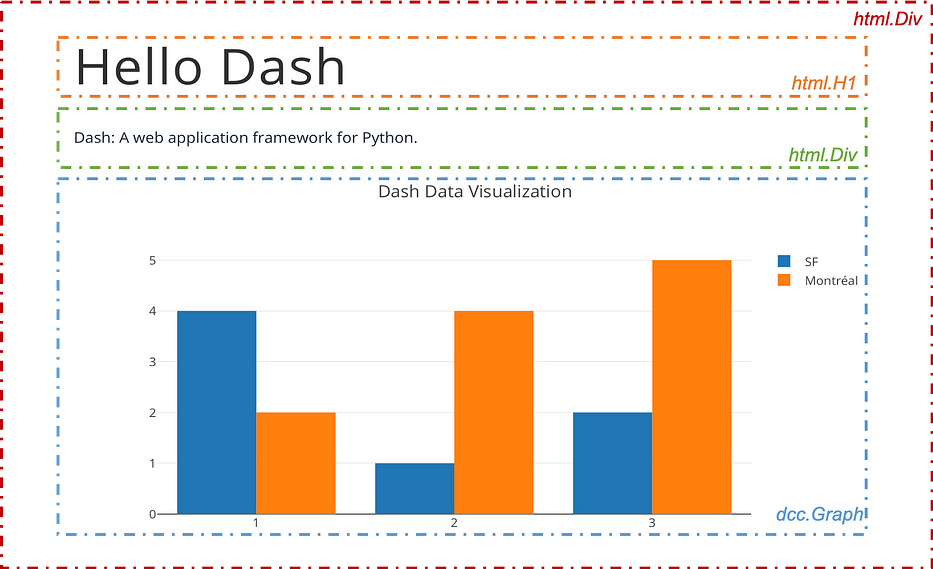
A simple Dash’s app can be developed using the following python lines:
import dash
import dash_core_components as dcc
import dash_html_components as html

app = dash.Dash(__name__)
app.title='Hello World'
app.layout = html.Div(children=[

	html.H1(children='Hello Dash!', style={'textAlign':
		'center', 'color': '#7FDBFF'}),

	html.Div(children='''
		Dash: A web application framework for Python.
		'''),

	dcc.Graph(
		id='example-graph',
		figure={
			'data': [
				{'x': [1, 2, 3], 'y': [4, 1, 2], 'type': 'bar',
					'name': 'SF'},
				{'x': [1, 2, 3], 'y': [2, 4, 5], 'type': 'bar',
				'name': u'Montréal'},
			],
			'layout': {
				'title': 'Dash Data Visualization'
				}
			}
	),
])
if __name__ == '__main__':
	app.run_server(debug=True)
The option debug=True allows to take the recent modifications into account without having to re-run the app.
To run the app, we use the following command line:
python app_file.pyYou get the following app running on http://127.0.0.1:8050/ :
Styling
It is possible to add a CSS file that over-writes the basic style of the app, allowing you to customize your graphics and HTML elements. To do so, the structure of the folder should be as follows:
app.py
assets/
   |-- style.css
   |-- custom-script.js
   |-- img.png
   |-- background.jpg
   |-- favicon.ico
It is mandatory to put the CSS file and all others inserted images in a folder called assets in order to be read by Dash. Once it's done, all we have to do is to specify style sheet using the following python lines:
external_stylesheets=["assets/style.css"]
app = dash.Dash(__name__, external_stylesheets=external_stylesheets)
Bootstrap
When building a dash-app, I personally prefer to work with Bootstrap. It is a python library for Plotly Dash, containing styled and advanced elements.
The setup is done by using the following command line:
pip install dash-bootstrap-componentsIt is important to include the bootstrap theme as one of the style sheets:
external_stylesheets=["assets/style.css", dbc.themes.BOOTSTRAP]
app = dash.Dash(__name__, external_stylesheets=external_stylesheets)
Boostrap contains many elements such as DropDownMenu, Navbar, Progress, Button, ... etc. One of the most useful elements is Layout, it allows to structure the dashboard using Rows and Columns which is very useful for the app's structure.
For further details, don't hesitate to visit the official documentation.
Callbacks
Like any other app, it is important to enable interactivity between graphics and this is done using callback functions.
Each inserted elements has two important features
- id: unique appellation of the element
- properties: differ from an element to another
Linking two elements in an app is done as follows:
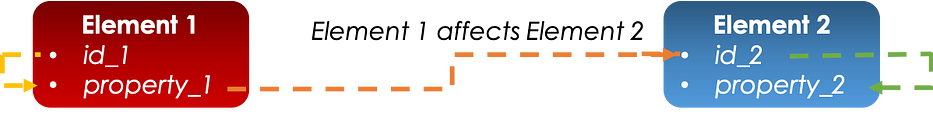
In this particular case the first element affects the second: the property_1 of the first element selected through its id_1 impacts the property_2 of the second one accessed through its id_2.
from dash.dependencies import Input, Output
@app.callback(
    Output(component_id='id_2', component_property='property_2'),
    [Input(component_id='id_1', component_property='property_1')]
)
def callback_function(input_value):
    """
    What to do
"""NB: it is possible de take many Inputs in the callback function.
Cache
When developing an app, it is very important to have elements in Cache in order to ease the loading and fasten the interactivity, Cache allows to do so.
Dash does not support a specific cache feature, but one way to overcome this problem is using global variables in python.
Tabs
Tabs in Dash, can be inserted using the dcc.Tab component, where its children are the elements composing the tab.
mport dash_html_components as html
import dash_core_components as dcc

external_stylesheets = ['https://codepen.io/chriddyp/pen/bWLwgP.css']

app = dash.Dash(__name__, external_stylesheets=external_stylesheets)

app.layout = html.Div([
    dcc.Tabs([
        dcc.Tab(label='1st Tab', children=[
            dcc.Graph(),
            ###
        ]),
        dcc.Tab(label='2nd Tab', children=[
            dcc.Graph(),
            ###
        ]),
        dcc.Tab(label='3rd Tab', children=[
            dcc.Graph(),
            ###
        ]),
    ])
])
Gallery
Dash has a gallery where you can browse and discover other dashboards, it is a good baseline and a source of inspiration.
Streamlit
Streamlit is an open-source app framework developed to create ML dashboards, mostly, in a very fast and efficient way using python. The setup is very simple and can be carried out using the following command line:
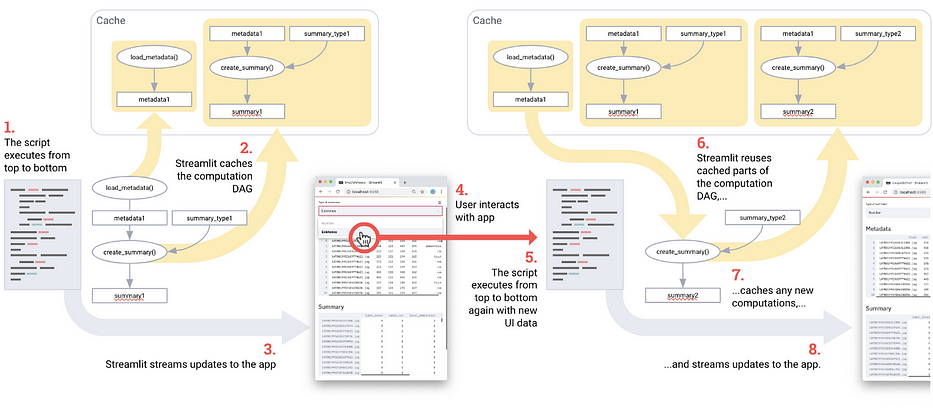
pip install streamlitCompared to Dash, Streamlit has better handling of Cache, as developed in the next sections, and thus allows faster development iterations using the following process:
Once your file is created, you can type this command line which will run your application on http://localhost:8501
streamlit run file.pyAs in Dash, it is possible de choose the mode Always re-run to get the modifications in live.
Streamlit’s widgets gallery contains multiple items which can all be inserted using one line of code: Markdown, SelectBox, Slider, Plot, etc... Note that the widgets can either be inserted in the one-page area or on the sidebar and that the insertion is done following a vertical stacking:
import streamlit as st
import matplotlib.image as mpimg
import matplotlib.pyplot as plt
from mpl_toolkits.mplot3d import Axes3D
from sklearn import datasets
from sklearn.decomposition import PCA
import pandas as pd

img=mpimg.imread('imgs/streamlite_funct.png')
iris = datasets.load_iris()
feature_names=['sepal length (cm)',
  'sepal width (cm)',
  'petal length (cm)',
  'petal width (cm)']
database=pd.DataFrame(iris.data, columns=feature_names)
database["class"]=iris.target

# plot the first three PCA dimensions
fig = plt.figure(1, figsize=(8, 6))
ax = Axes3D(fig, elev=-150, azim=110)
X_reduced = PCA(n_components=3).fit_transform(iris.data)
ax.scatter(X_reduced[:, 0], X_reduced[:, 1], X_reduced[:, 2], c=iris.target,
           cmap=plt.cm.Set1, edgecolor='k', s=40)
ax.set_title("First three PCA directions")
ax.set_xlabel("1st eigenvector")
ax.w_xaxis.set_ticklabels([])
ax.set_ylabel("2nd eigenvector")
ax.w_yaxis.set_ticklabels([])
ax.set_zlabel("3rd eigenvector")
ax.w_zaxis.set_ticklabels([])

def main():
    ########### Sidebar ##############################

    st.sidebar.markdown("# Hello World")
    st.sidebar.selectbox('Select a tool', ["Dash", "Kibana", "Streamlit", "Bokeh"])

    st.markdown("## Multiselection")
    st.multiselect('Select a tool', ["Dash", "Kibana", "Streamlit", "Bokeh"])

    st.markdown("## Radio buttons")
    st.radio('Select a tool', ["Dash", "Kibana", "Streamlit", "Bokeh"])

    st.markdown("## Slider")
    st.slider('Select a Number', min_value=1, max_value=4, value=1)

    st.markdown("## Image")
    st.image(img, width=500)

    st.markdown("## DataBase")
    st.dataframe(database)

    st.markdown("## Plot")
    st.write(fig)

if __name__ == "__main__":
    main()
We get the following app:
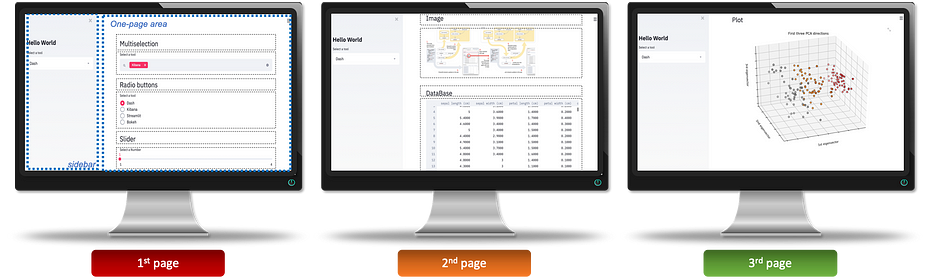
The function st.write is very important and can be used to insert many python elements. For more details, I advise you to read streamlit's documentation.
Interactivity: Each element can be assigned to a variable which stands for its current value, it can, next, be used to update another element and hence the interactivity.
Cache
Cache is usually used to store data that is constant and does not change no matter the choices made on the app. We might very often define functions in the app where there is no use for them to be re-run every time the app is refreshed, we can cache them using the following python code:
@st.cache
def function_1():
	####
Tabs
In many apps, Tabs can be very important: one way to do so in Streamlit is adding a selectbox in the sidebar which choice will affect the structure of the dashboard and that using if statements on the value of the box.
st.sidebar.markdown("Tabs")
tab=st.sidebar.selectbox('Select a Tab', ["Home", "Documentation", "Partners", "Contact"])
if tab=="Home":
	#Develop the one_pager
	##
elif tab=="Documentation":
	###
elif tab=="Partners":
	###
elif tab=="Contact":
	###
Health app — Streamlit
When I started discovering Streamlit,I have decided to put it into use by developing a simple health app allowing to grasp the nettle.
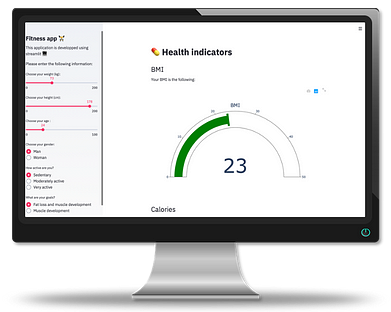
You can visit the app using this url, the script is hosted in this git repository. For more apps, you can visit the official gallery.
Bokeh
Bokeh is a python library which allows to create an interactive dashboard as well. It can be installed using the following command-line:
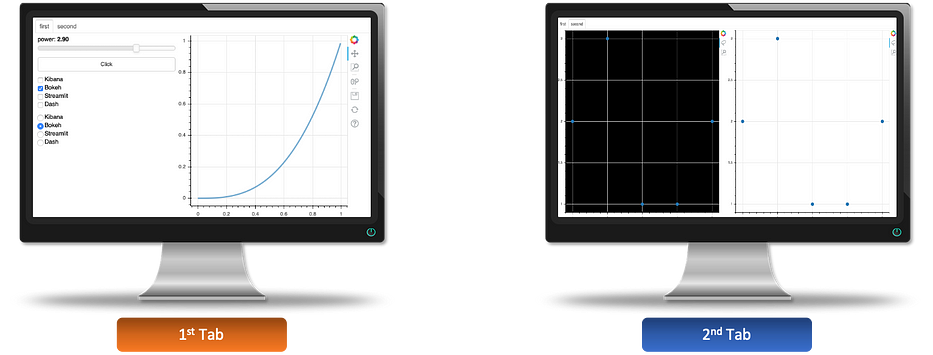
pip install bokehThe below app, for instance, can be created using the following python script:
from bokeh.io import show, curdoc
from bokeh.plotting import figure, ColumnDataSource
from bokeh.layouts import row, column
from bokeh.models.widgets import Tabs, Panel
from bokeh.models import Slider, CheckboxGroup, RadioGroup, Button, CustomJS


#data source
x = [x*0.005 for x in range(0, 200)]
y = x
source = ColumnDataSource(data=dict(x=x, y=y))

#Plots
plot_1 = figure(plot_width=400, plot_height=400)
plot_1.line('x', 'y', source=source, line_width=3, line_alpha=0.6)

plot_2=figure(tools='box_zoom, lasso_select')
plot_2.circle(x=[1,2,3,4,5], y=[2,3,1,1,2])
plot_2.background_fill_color = 'black'

plot_3=figure(tools='box_zoom, lasso_select')
plot_3.circle(x=[1,2,3,4,5], y=[2,3,1,1,2])

#widgets
slider = Slider(start=0.1, end=4, value=1, step=.1, title="power")
button = Button(label='Click')
checkbox = CheckboxGroup(labels=['Kibana', 'Bokeh', 'Streamlit', 'Dash'])
radio = RadioGroup(labels=['Kibana', 'Bokeh', 'Streamlit', 'Dash'])

#Interactivity
callback = CustomJS(args=dict(source=source), code="""
        var data = source.data;
        var f = cb_obj.value
        var x = data['x']
        var y = data['y']
        for (var i = 0; i < x.length; i++) {
            y[i] = Math.pow(x[i], f)
        }
        source.change.emit();
    """)
slider.js_on_change('value', callback)

#Plots zoom-linking
plot_2.x_range=plot_3.x_range
plot_2.y_range=plot_3.y_range

#Tabs
first=Panel(child=row(column(slider, button, checkbox, radio), plot_1), title='first')
second=Panel(child=row(plot_2,plot_3), title='second')
tabs=Tabs(tabs=[first, second])

#App
curdoc().add_root(tabs)
show(tabs)
Note that once we define the figure plot, we use the syntax plot.graph to assign the desired graph to it. The data is handled using ColumnDataSource and layout using row, column. We customize the added widgets, Slider, CheckboxGroup, RadioGroup, Button, and link them to graphs using the JS callback CustomJS. To run your app, on http://localhost:5006/myapp, you can use the following command-line:
bokeh serve --show myapp.pyGallery
As all the other tools, Bokeh has a very rich gallery to start with.
Elastic stack
Elasticsearch
Elasticsearch is a special type of tables’ indexation which gives a faster search engine. We can transform a pandas database into an Elasticbase and then visualize it using Kibana which is the visualization tool of the stack Elastic. You, first, need to download Kibana & Elasticsearch depending on your OS.
Once installed, we will want to properly index our pandas dataframe using elasticsearch. To do so, we first need to launch both of services elasticsearch and kibana using the command-lines:
./elasticsearch-7.6.1/bin/elasticsearch
./kibana-7.6.1/bin/kibana
Once Kibana is launched, we can use this python script to sent data to the Elasticsearch services
import pandas as pd
from elasticsearch import Elasticsearch

# Database loading and service openning
database=pd.read_excel("data/test_db.xlsx")
es_client = Elasticsearch(http_compress=True)

#Elasticsearch does not accept NAN values
print(database.isna().sum().sum())

df=database.copy()
INDEX="laposte" #Its name in Elasticsearch (laposte for example)
TYPE= "record"

def rec_to_actions(df):
    import json
    for record in df.to_dict(orient="records"):
        yield ('{ "index" : { "_index" : "%s", "_type" : "%s" }}'% (INDEX, TYPE))
        yield (json.dumps(record, default=int))

e = Elasticsearch()
r = e.bulk(rec_to_actions(df))

#Verify if everything went fine
print(not r["errors"])
Kibana
The servie kibana is launched in the local host on the port 5601, we can visit it in a browser using the address localhost:5601. Once on the main page, we can click on Dashboard and Create dashboard as follows:
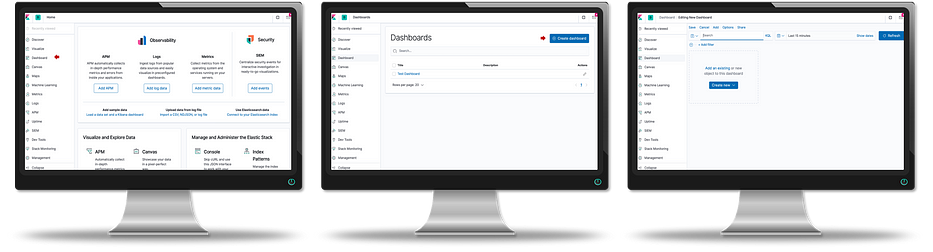
We can now add widgets through these steps:
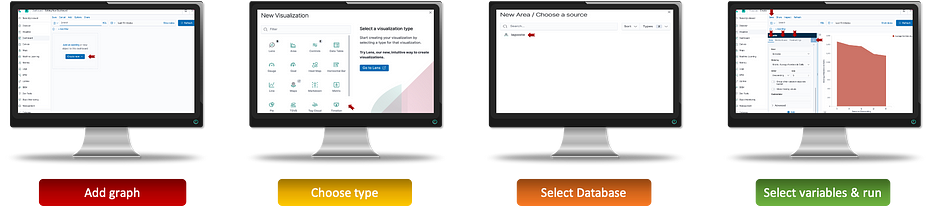
The inserted graph can be positioned using the cursor which makes the layout easy to customize. Note the presence of a searching bar where the data is indexed using Elasticsearch, this makes the querying less time consuming and adds more interactivity to the dashboard, especially when dealing with large databases. The interactivity is automatically handled in kibana.
Tabs
Tabs in Kibana can be created using embedded links in markdowns widgets. You first create all the tabs each one in a different dashboard and then add in each one the embedded links to the others.
Gallery
Do not hesitate to visit kibana’s official gallery.
Heroku deployment
Once your app is developed, you can host it online so it can be accessed by anyone using an Url. One way to do so it to use Heroku which offers this free service with some limitations.
You first need to sign up and then create a heroku app online which will be linked to your git repository. The repo should have the following structure:
.
├── app.py
├── requirements.txt
├── setup.sh
└── Procfile
You can check my git repository for more information. On your local git folder run the following command-lines:
heroku create
git push heroku master
heroku ps:scale web=1
heroku open
Your app will be on constant standby to every push you make in your git in order to take the latest changes into account.
Conclusion
Apps and dashboards are a very important and decisive phase of each project, they allow to summarize our work and make it more accessible to the user through an instinctive interface. The use of each technology mainly depends on your delivery and your deadlines: some tools allow more flexibility, others are faster to develop:
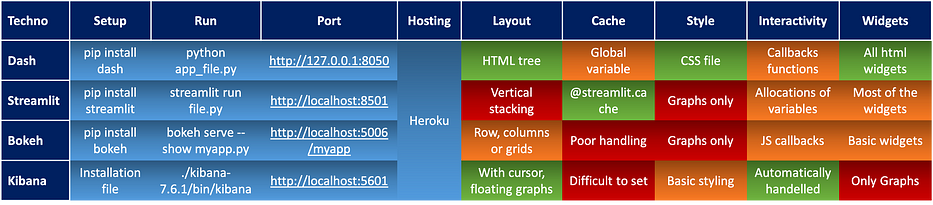
In my personal point of view, if all the conditions are met, Dash can be the best option to go with.